In former years, data coming from the ECU was recorded onboard, and retrieved afterwards. This made engine tuning an absolute nightmare, as there was no way to see a live feed of data. As problems occurred (and oh, did they occur), whoever was tuning the engine had to sift through (thankfully timestamped) data and try to figure out what went wrong.
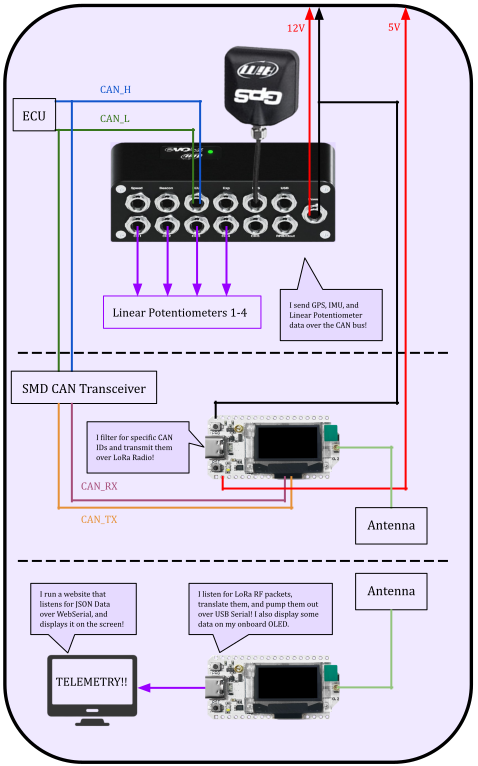
This project aims to gain live telemetry data from the running car's CAN bus in a wireless fashion. That means no wires.
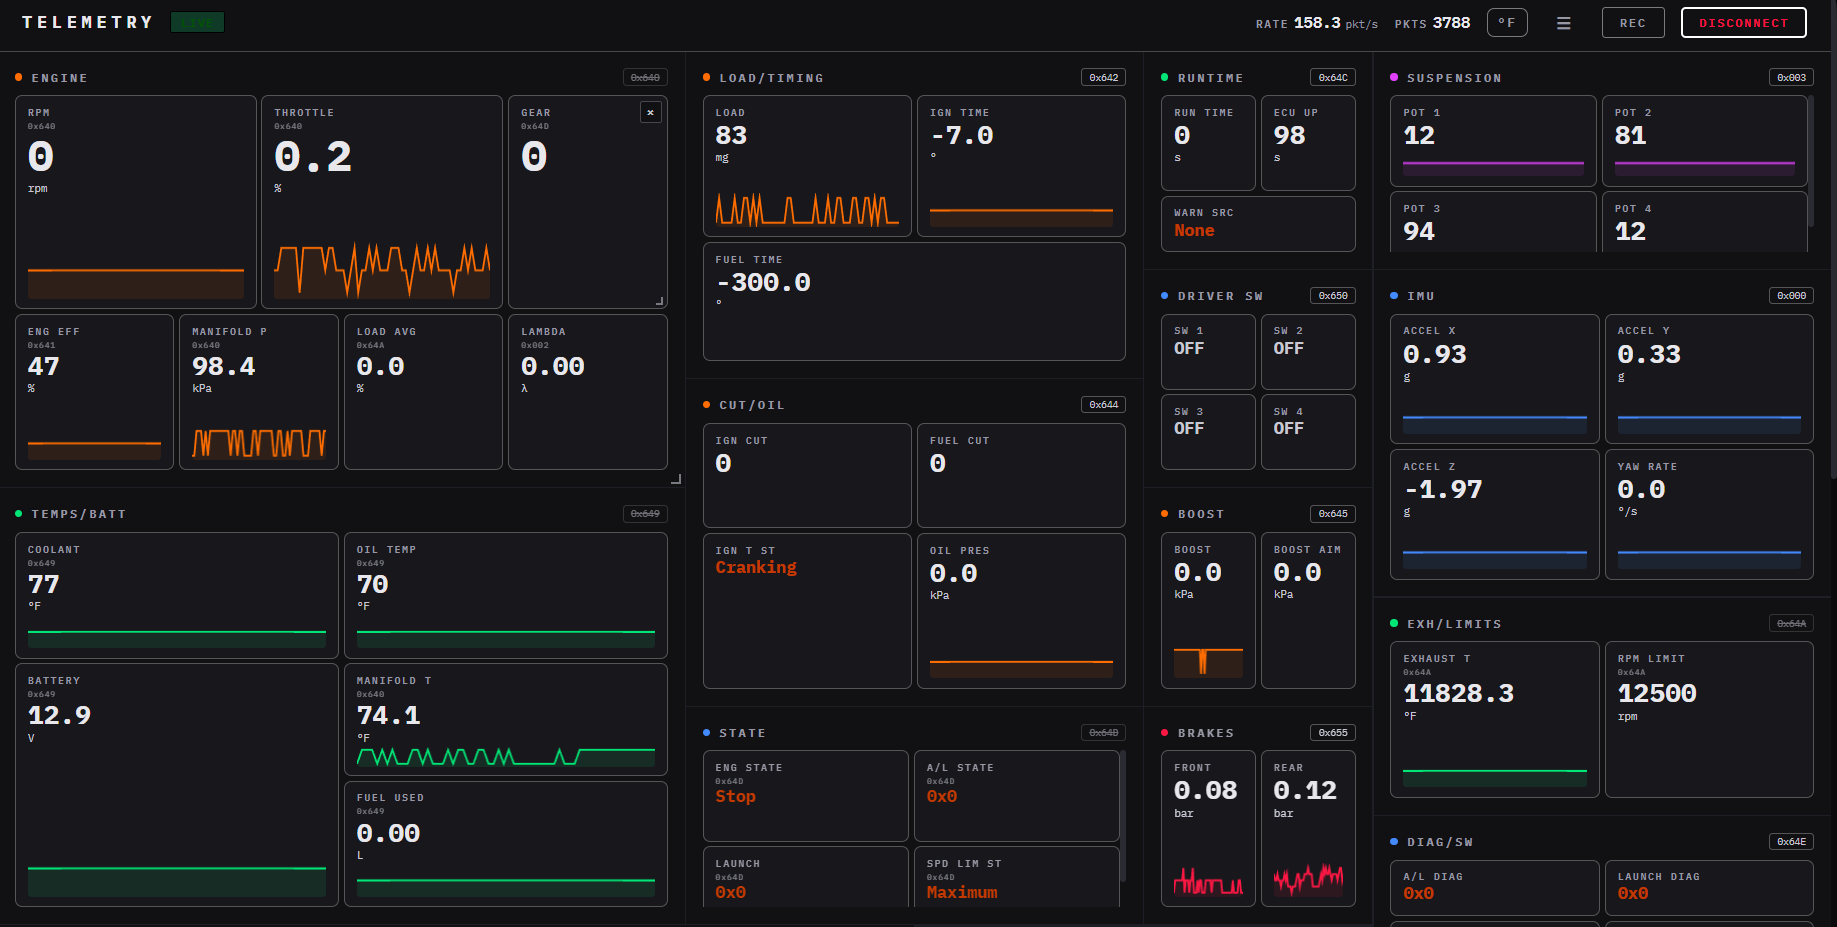
This subsystem currently meets MVP: it's transmitting and receiving the requested telemetry data over LoRa with no wires. The web dashboard is capable of displaying and recording all said data in real time. (thank you for your passion in graphic design, Claude!)
Plugs into the AiM EVO4S, one connected in parallel to each suspension spring.
Various AiM-Branded Wires
Extremely over-priced proprietary connectors to deliver 12V to the AiM EVO4S, connect the 4 AiM Linear Potentiometers, and patch into the vehicle CAN bus. (Wait... Did I ever say any of the AiM stuff was fairly priced?)
1x antenna
The amazon listing no longer exists
TODO: Circumvent over-priced AiM Technologies
Design a custom board that reads potentiometer values, + custom GPS module, and outputs corresponding data on CAN. May be able to salvage the enclosure from the unused AiM EVO4, or even the AiM EVO4S.
Note from the future: This has been accomplished. There will be a new writeup linked here when it passes design reviews!
The ESP32 is especially useful for us (over, say, a rpi or arduino), since it has a CAN implementation (NOT TRANSCEIVER). We will be using a board that encompasses both an ESP32 and Lora module. (See components)
If you don't know what a microcontroller is, GET OU- oh that's mean i shouldn't say that *cough- have a little... chat with google. Maybe look at the wikipedia page. Maybe consider... asking someone in person ikr
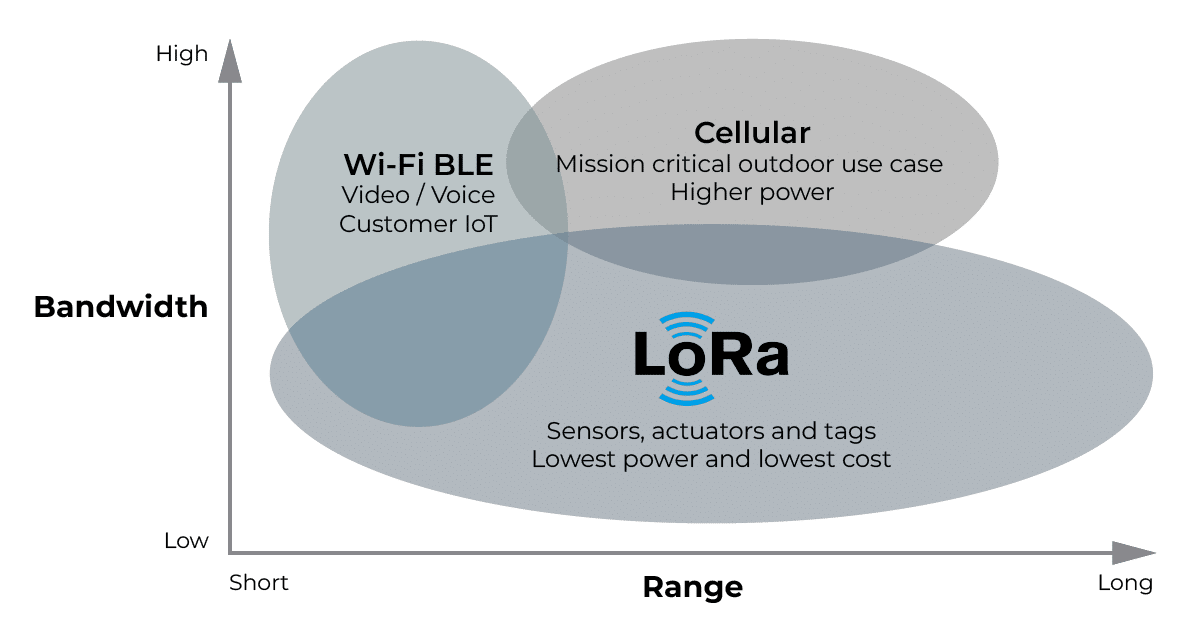
LoRa (from "long range") is a physical proprietary radio communication technique based on spread spectrum modulation. LoRa can be thought of as the radio signal technology (similar to Wi-Fi or cellular).
The technology is primarily used for applications where small amounts of data need to be transmitted infrequently from hard-to-reach locations.
Ryan Brennan has written this excellent write-up on CAN, which I've re-formatted here. If you don't understand the definition below, go read it.
CAN is a multi-master, error-resistant, priority-supportive, broadcast-style, message-ID-based, differential signal data transmission protocol.
Overview
The ESP32 calls the CAN bus “TWAI,” for some stupid reason. If you walk up to me and say "TWAI," I will pretend like I don't understand. If you walk up to an ESP32 and say "CAN," it actually won't understand.
Definiton: CAN is a data transmission protocol used mainly in things that go vroom. Since we go vroom, we use CAN.
A CAN Bus is a bus that CAN hold passengers. *cough* is how our ECU communicates with sensors, actuators, and programmers. This is really handy, since adding another component is as simple as running 2 short wires to the nearest can pair in your wiring harness.
A tirade against MoTeC: There's a really handy dictionary that ships with all decent ECUs, called a "CAN database." These usually appear with the *.dbc file extension, but use standard ASCII encoding. Each message sent over the CAN bus is 8 bytes wide, with each message being split up into multiple values of varying, arbitrary length, decided in advance by... MoTeC. In other words, all data coming off the CAN bus is indecipherable without said dictionary. Guess who didn't ship their ECU with a CAN database? MOTEC, OF COURSE! Thanks to some rando on some pre-historic forum, however, we were able to obtain a copy of this vital file (which was allegedly leaked by a sympathetic MoTeC engineer).
CAN Transceiver (or lack thereof)
Since there is no transceiver on the ESP32 board itself, we've soldered one onto our connector hub PCB to be able to translate CAN.
The initial struggle was getting the AiM to output CAN, since we needed it to spit out GPS and accelerometer data. After much of a struggle, we got this working and brought it out for a test spin.
AiM MUST GET ACK
The AiM WILL NOT output packets properly (only the first message, several thousand times per second), if it does not receive an ACK from the CAN bus. If the ESP32 is your only other node, it must be set to TWAI_MODE_NORMAL, so it properly sends ACK signals.
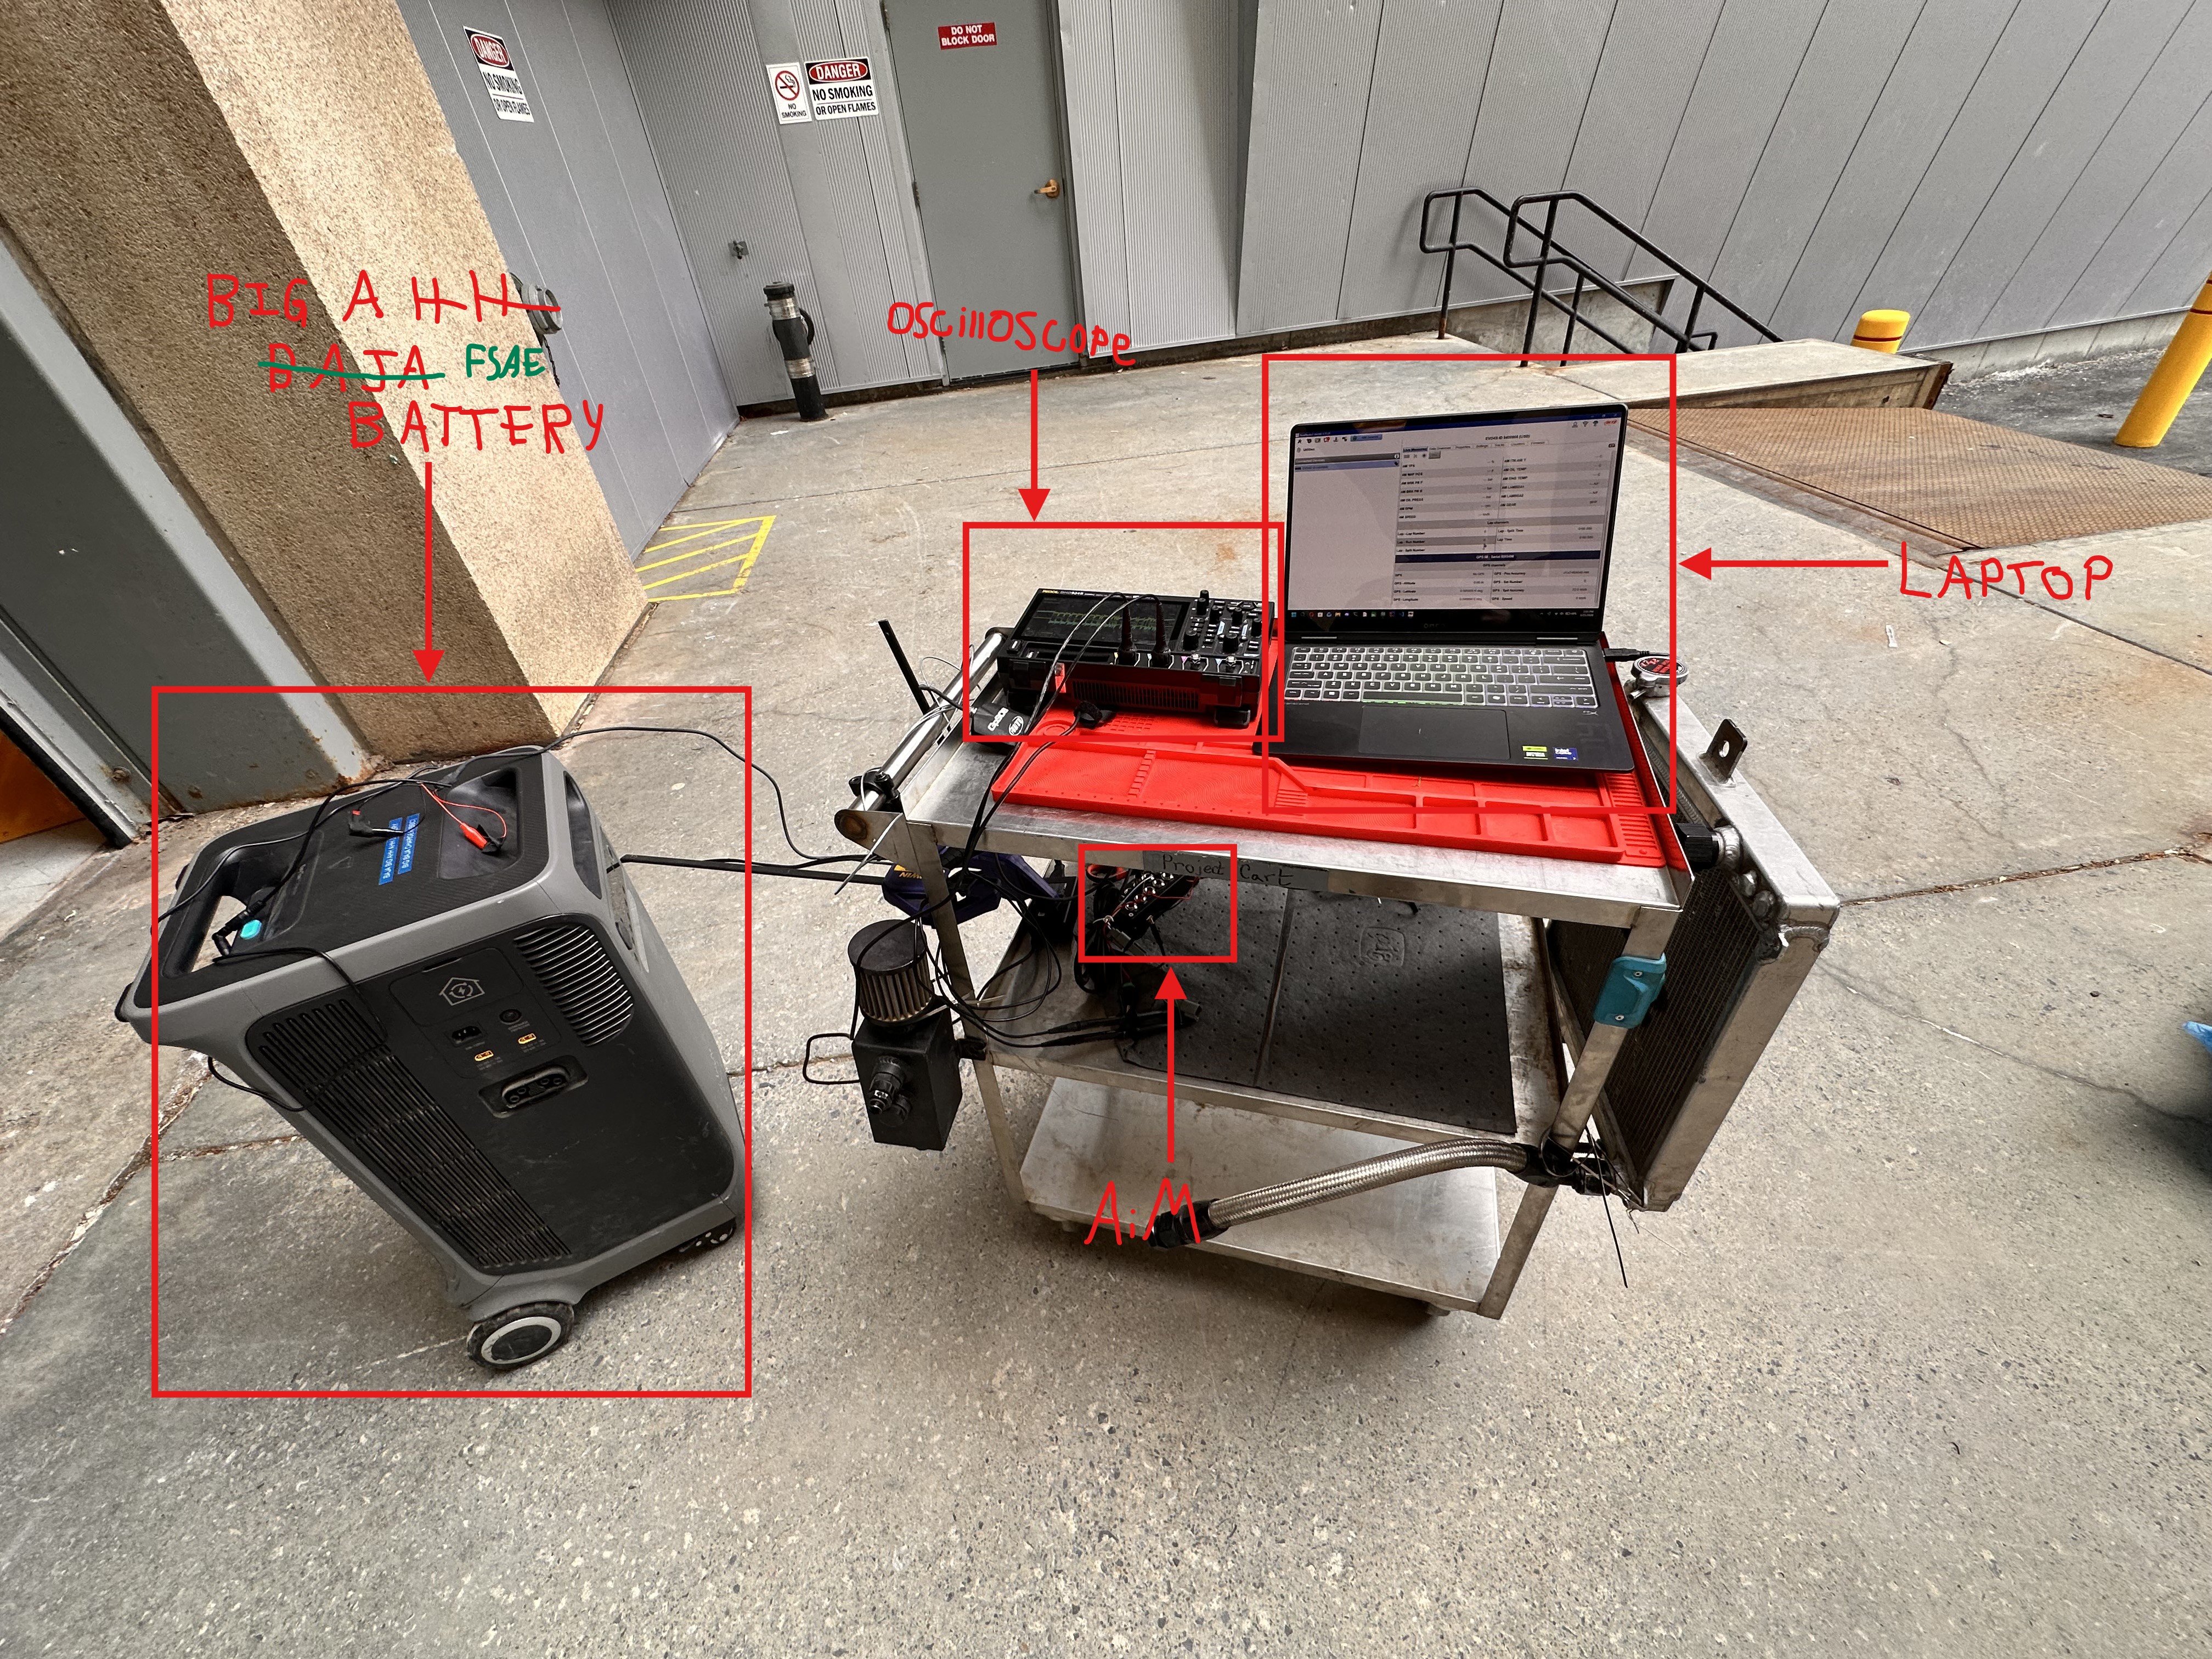
The test rig we used to verify GPS and LoRa functionality.
I'll just re-iterate the outcome of that test by formatting my own writeup below:
Two main teams were used in this test:
The AIM - configured to transmit accelerometer and GPS data over CAN - was attached to a cart, alongside a Heltec ESP32 + LoRa - configured to translate CAN and transmit accelerometer and GPS data -, oscilloscope, and laptop. A large battery was wheeled along next to it. (seen in the image above)
A laptop connected to a Heltec ESP32 + LoRa - configured to receive and display accelerometer and GPS data - was carried around.
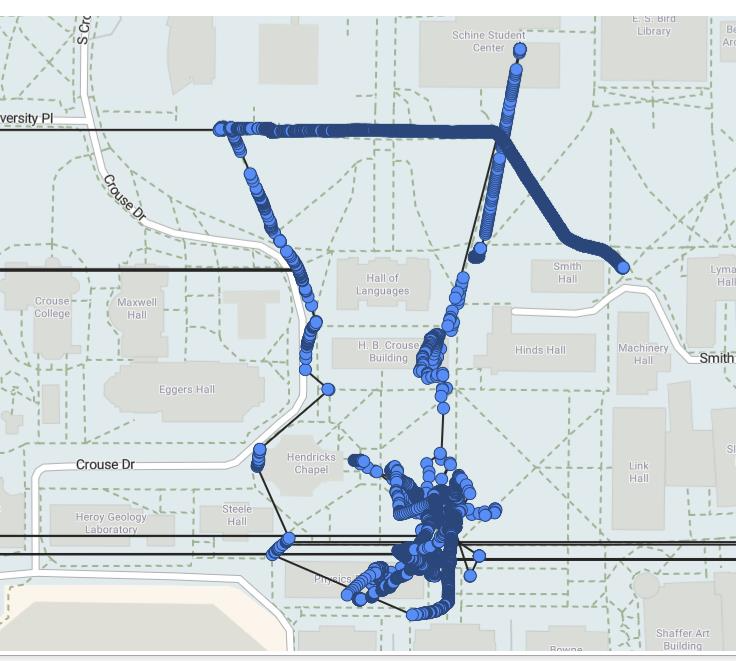
Both teams moved their equipment around campus, team 2 notifying team 1 over a phone call when packets were not received. It was observed that packets were received through one building (Hall of languages), but when the teams were positioned with the HOL and physics buildings blocking line of sight, no packets were received. As soon as team 1 cleared the corner of the physics building, packets were received, indicated by a jump through the building on the GPS map displayed on team 2’s laptop.
The teams then positioned themselves at opposite ends of that long road in front of schine, team 2 with high ground. With direct line of sight, packets were intermittently received when team 2 was at the guard booth and team 1 was approximately in front of schine (needs verification, exact distance unknown). It was noted that as the receiving antenna was pointed directly at team 1, no packets were received, but as the antenna was pointed orthogonally to team 1, packets were intermittently received. This raised questions about which antennas would be used in the actual car.
Data was recorded throughout and exported as a csv. As team 2 returned to link hall, the addition of GPS positional accuracy to the list of transmitted telemetry data was considered, as well as possibly changing the RF polling frequency and bandwidth due to the increased payload size with the transmission of more CAN ids.
Takeaway
GPS is functional. We need to add input rejection, as we cannot have our car traveling to Africa and back in a tenth of a second.
Case in point
We need to test with the addition of more CAN ids to the transmission list.
We need to select a final antenna and test with it.
The telemetry system we used during testing sent each CAN message as a separate LoRa packet. This worked fine for 2-3 data sources, but completely broke when all the requested CAN IDs were added (some at 50Hz!). Each LoRa packet is comprised of a header and data (simplified here for the sake of clarity), so tiny packets at high rates meant most of the airtime was wasted on headers rather than data.
After doing more research, I discovered that there is a way to drastically decrease the size of the header, by enabling something called Implicit Mode.
LoRa uses two types of packet formats for data transmission: explicit and implicit.
In explicit mode, a LoRa packet includes the following elements:
Preamble is used to synchronize the receiver with the transmitter. It MUST consist of 8 symbols for all regions as mentioned in the LoRaWAN Regional Parameters document. However, the radio transmitter will add another 4.25 symbols resulting in a final preamble length of 8 + 4.25 = 12.25 symbols.
PHDR (Physical Header) is an optional element only present in the explicit mode that contains information about payload size and CRC (Cyclic Redundancy Check).
PHDR_CRC (Header CRC) is an optional field that contains an error detecting code for correcting errors in header.
The PHDR and PHDR_CRC are encoded with the Coding Rate of 4/8.
PHYPayload contains the complete frame generated by the MAC layer. The maximum payload size varies by DR (Data Rate) and is region-specific.
CRC is an optional field that contains an error detecting code for correcting errors in the payload of uplink messages.
The PHYPayload and CRC are encoded with one of the Coding Rates (4/5, 4/6, 4/7, or 4/8). The complete frame is then sent using one of the Spreading Factors (SF = 7 to 12).
The following figure shows the physical layer structure of uplink and downlink packets that uses explicit mode.
Physical structure of an [explicit] uplink packet
Physical structure of a[n explicit] downlink packet
In implicit mode, the header is removed from the packet where the payload size and Coding Rate are fixed or known in advance.
Beacons use LoRa radio packet implicit mode for sending time synchronizing information from gateways to the end devices.
The following figure shows the structure of a LoRa packet that uses the implicit mode.
By enabling implicit mode, we eliminate a little redundancy, but still have nowhere near the datarate required to transmit each CAN ID as an individual LoRa packet.
LoRa is fundamentally packet-based, so there's no way to stream continuous data. Every transmission pays a fixed cost:
Component
Duration (Spreading Factor 7 & 500kHz Bandwidth)
Preamble (8 sym + 4.25 sync)
3.14 ms
Explicit header (8 sym)
2.05 ms
Total overhead per packet
~5.2 ms
For an 8-byte CAN frame, a very large percentage (~~60%) of every transmission is overhead. The theoretical data rate is 21,875 bps, but effective throughput drops to ~30-40% of that when sending small packets individually.
I asked Claude to build a calculator to sweep all possible packet sizes and find the minimum that satisfies the throughput inequality provided by semtech:
Instead of sending one LoRa packet per CAN frame, we buffer multiple CAN messages and pack them into a single fixed-size LoRa packet, which we send on a timed interval. One large packet amortizes the preamble cost across the entire batch. However, if that packet is dropped due to interference, we lose all CAN messages in that packet.
I hard-coded both the transmitter and receiver with the same packet structure, so we can enable Implicit mode, which disables transmission of packet length and coding rate, saving ~2 ms per packet.
Byte 0-1:  16-bit presence bitmask (Nth bit set = Nth data follows)
Byte 2:    8-bit rolling sequence number
Byte 3+:   concatenated CAN payloads, ascending slot order, zero-padded to 64 bytes
The bitmask makes each packet self-describing. Not every CAN ID must appear in each packet, so data can enter each packet regardless of its rate (10 Hz or 50 Hz), and the receiver loops through the set bits to know exactly which payloads are present, and how many bytes to read for each.
The RfAggregator class handles buffering and timing. We feed it CAN frames as they arrive, and call poll() repeatedly, which handles the sending and buffering:
// CAN ISR/task feeds data inagg->feed(msg.identifier,msg.data,msg.data_length_code);// poll() fires on a timer, builds a packet from dirty slots, sends itagg->poll();
Inside RfAggregator, we assign each CAN ID a slot index. When we call feed(), the payload gets copied into a queue and the slot is marked dirty. When poll() gets called from our loop and the radio is free, _buildPacket() walks through the dirty flags, packs what fits into a buffer, clears the respective flags, zero-pads the buffer to 67 bytes, and (finally) hands it off to the radio.
I've bounded the CAN receive loop to 64 frames per iteration to ensure that packets get sent even when no CAN data is received.
No Serial Printing From CAN Loop!
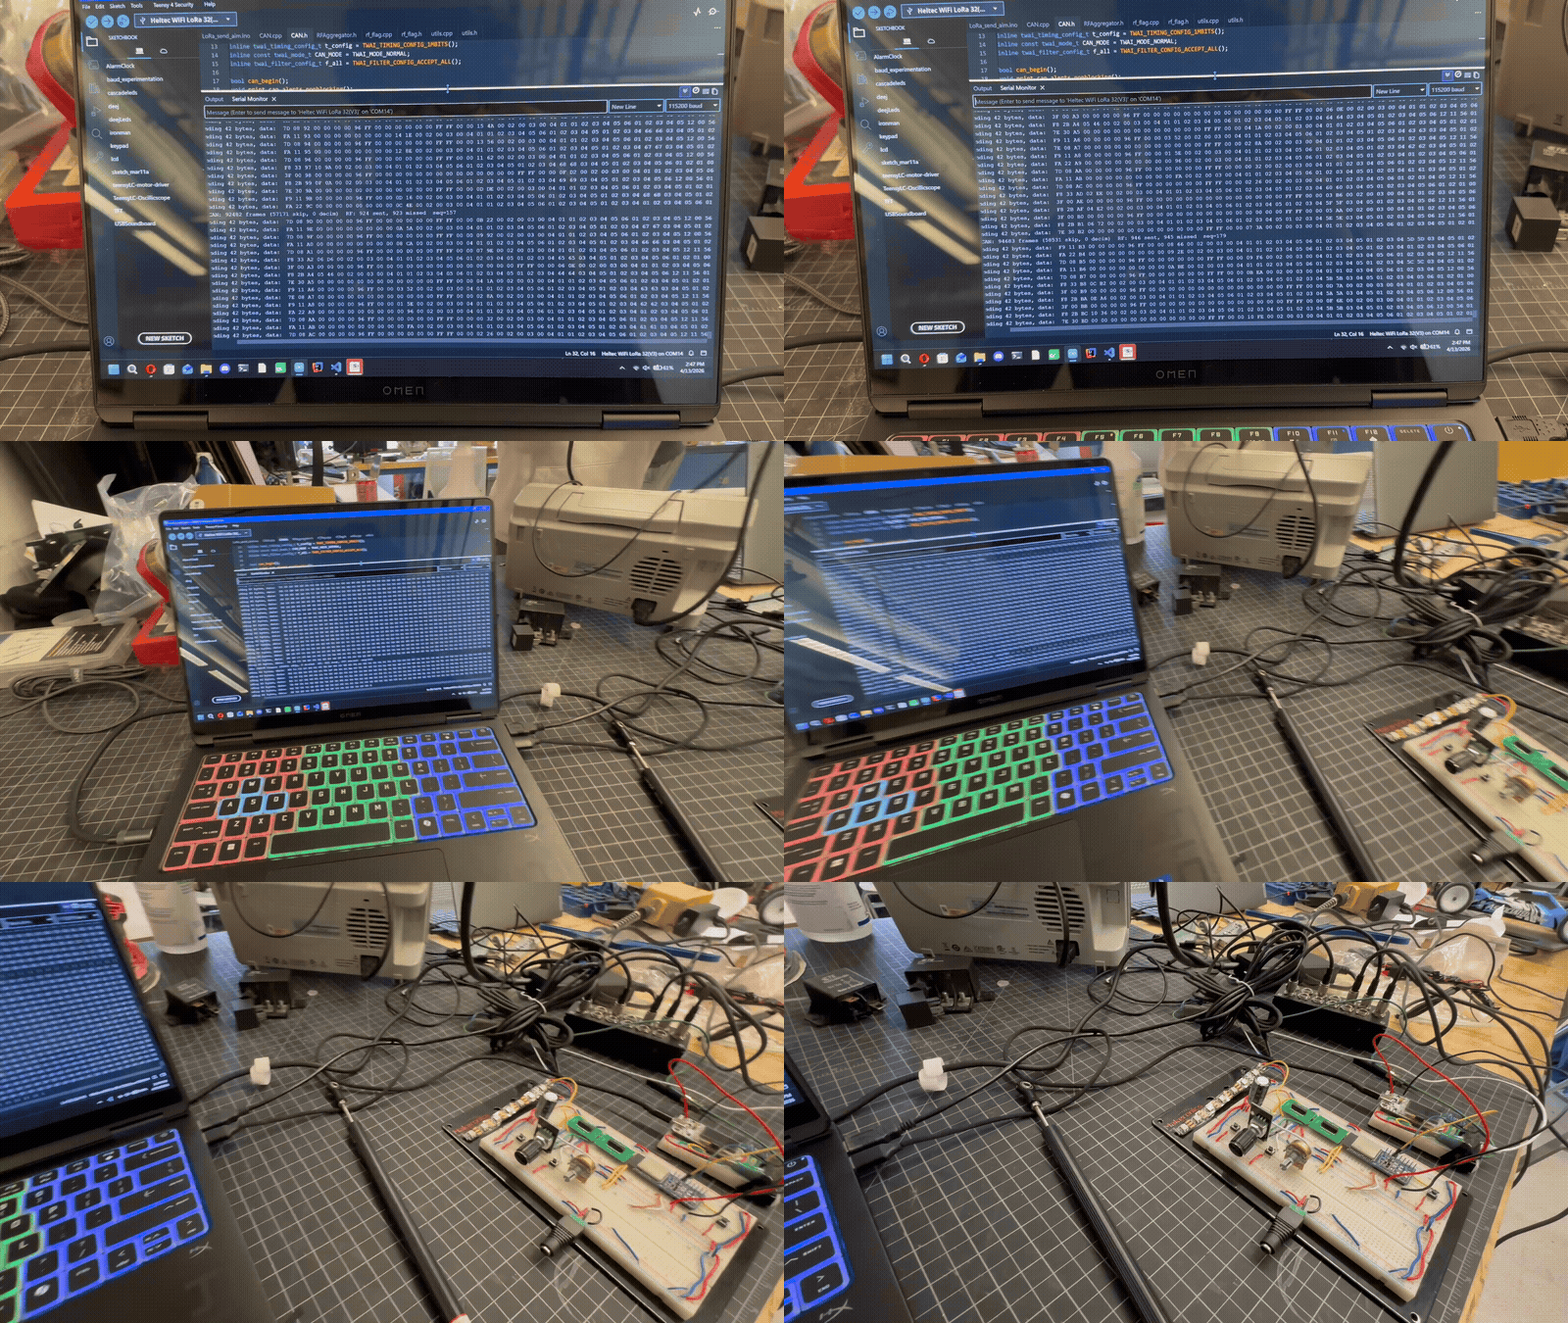
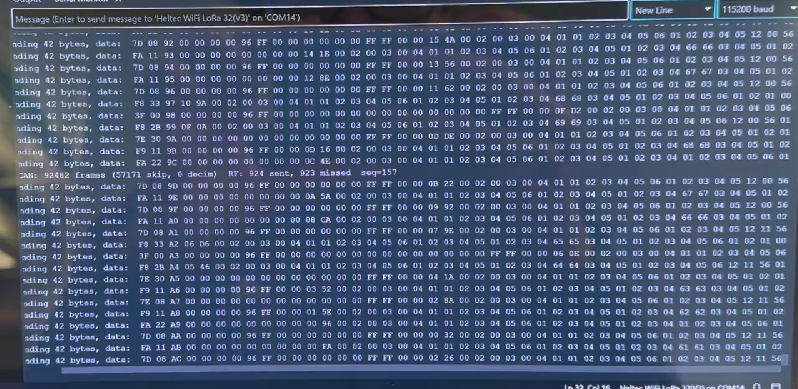
I had to remove per-frame serial logging as it's a blocking operation, and was causing can packets to be skipped. Instead, we keep track of what's sent and print it to serial occasionally. This, of course, is disabled when no serial interface is open.
NB: when this screenshot was taken, we were sending 42 B/packet. That has now changed to 67 B/packet.
We also substitute what enumeration values we know about from MoTeC.
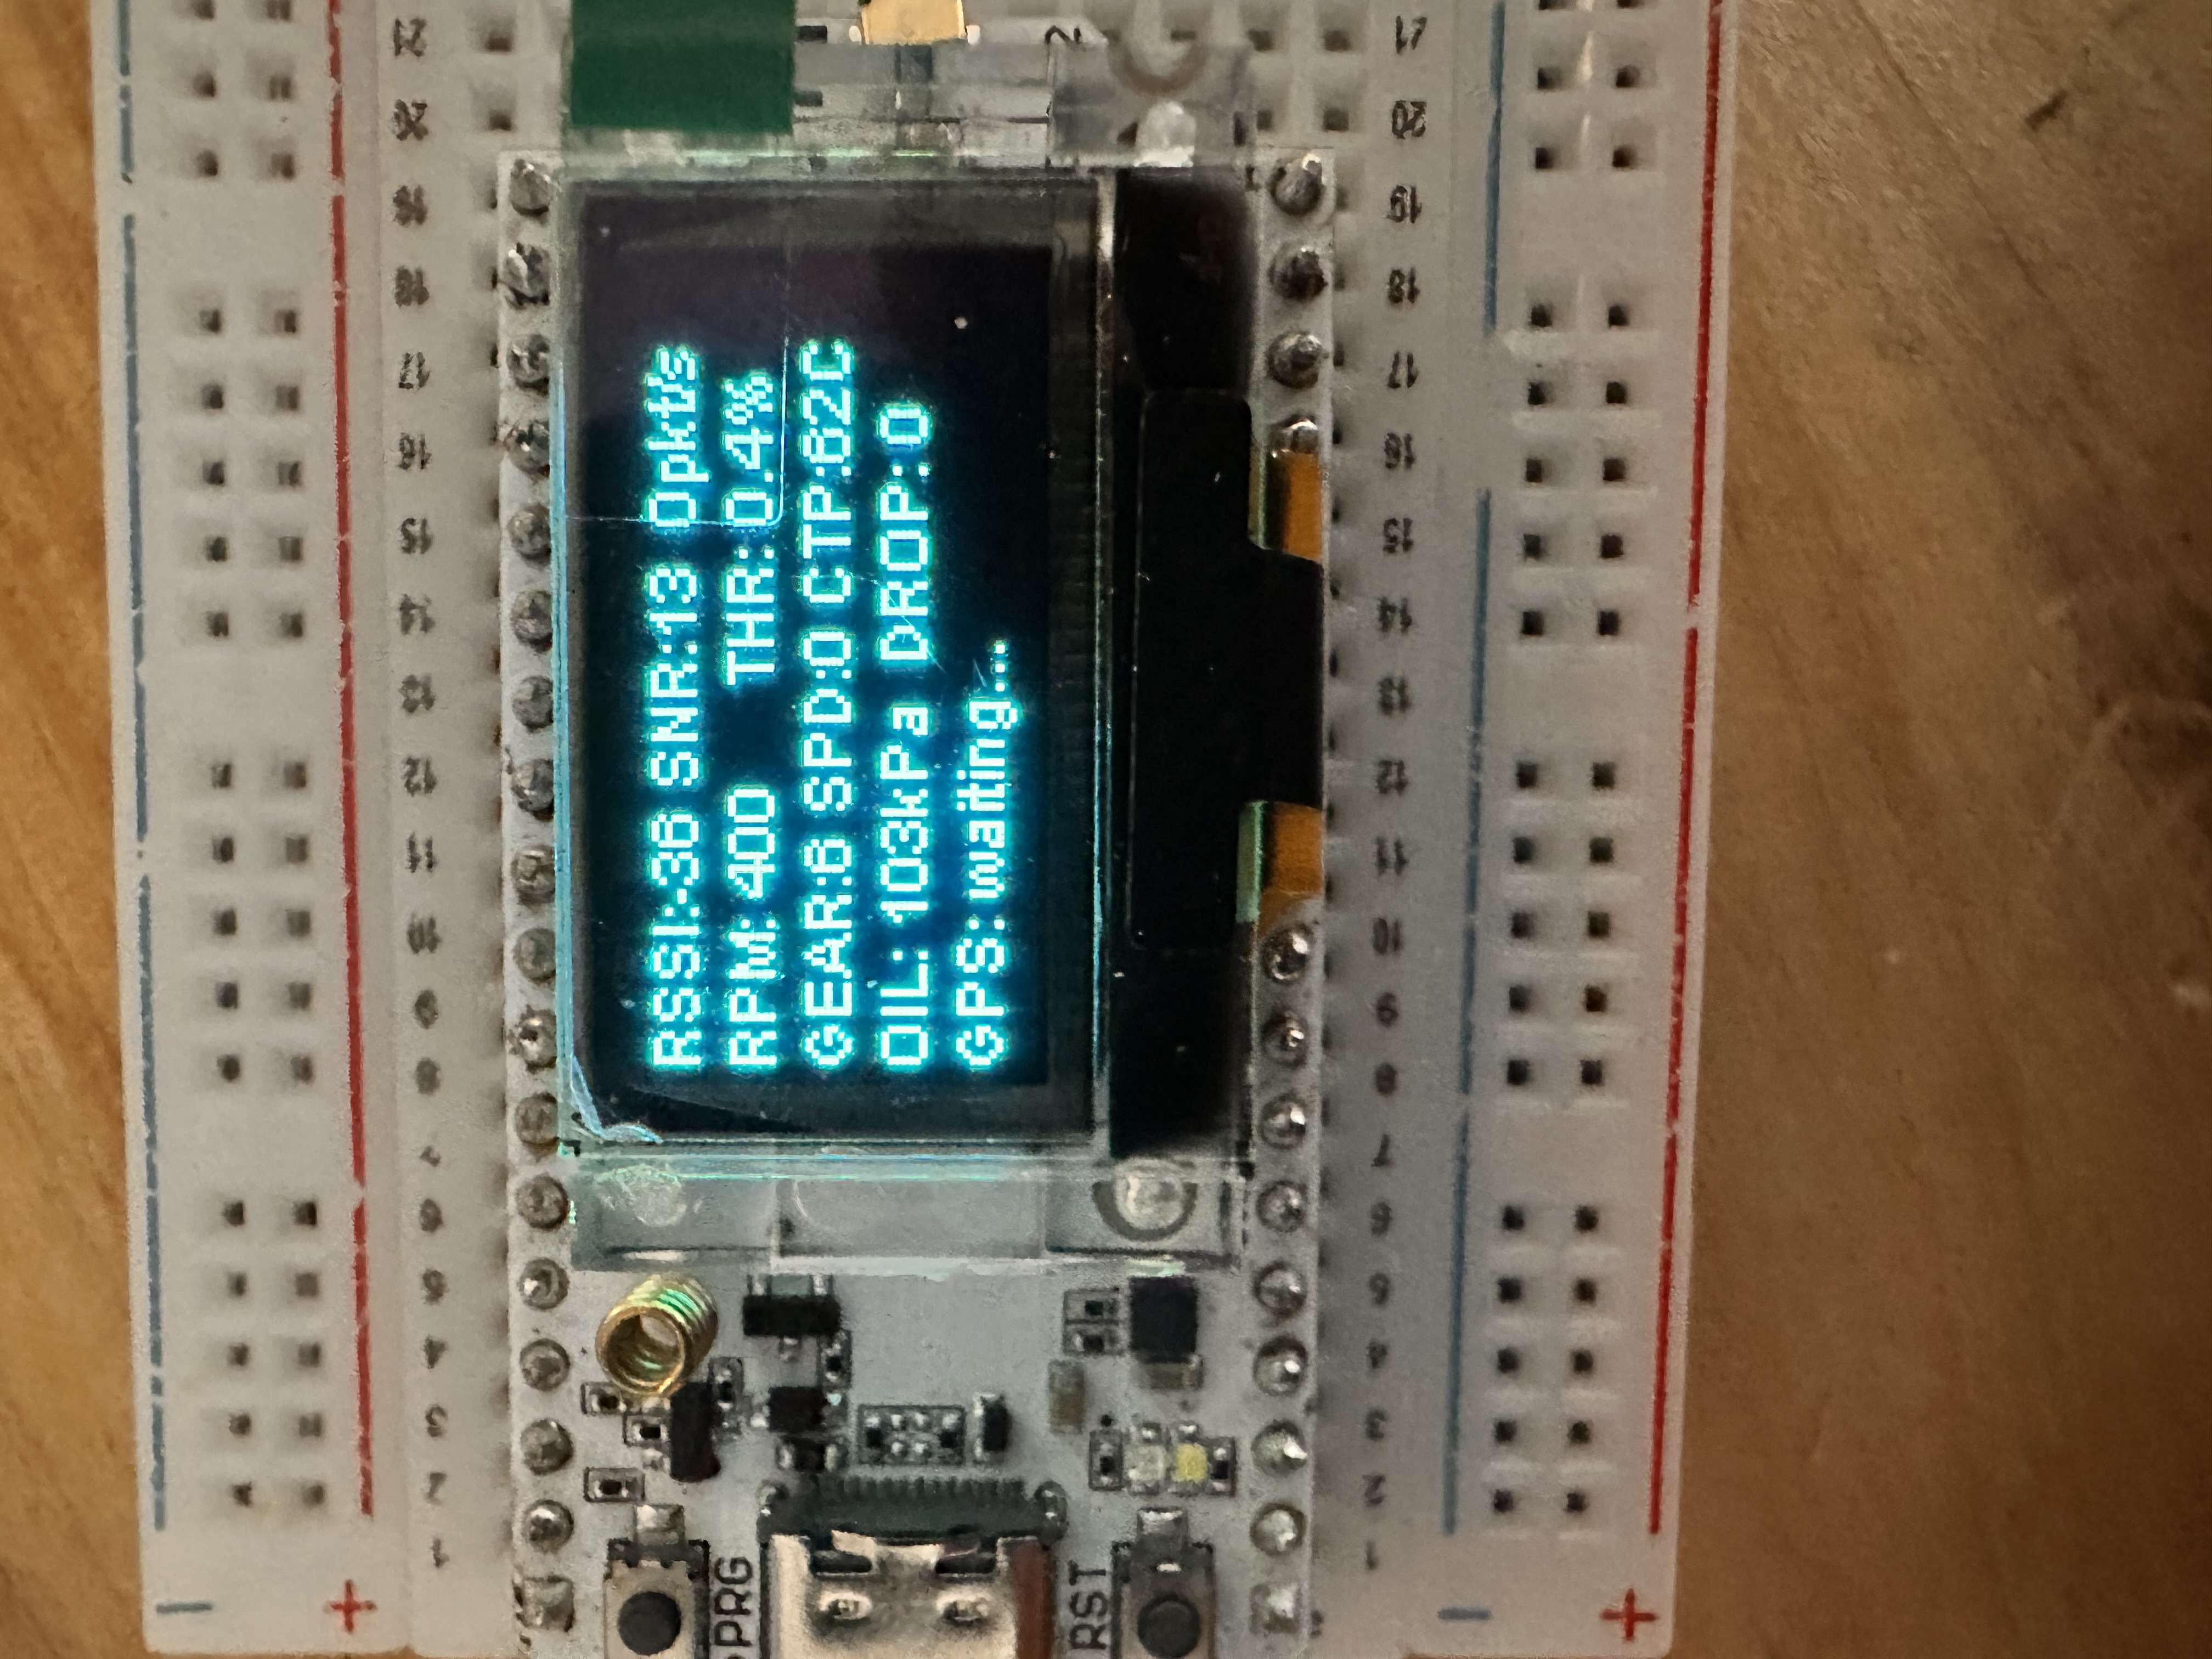
We watch the rolling sequence number, which should increment for each packet, to detect dropped packets. The OLED shows RPM, throttle, gear, coolant temp, oil pressure, GPS coordinates, and link stats, although I rarely watch that.
First successful transmission test with all CAN IDs
My initial web dash design was very inefficient and looked terrible. Claude was tasked to rebuild it from scratch to handle several hundred packets/sec without lag. The corresponding notes below were also created by Claude. It's safe to say that while graphic design IS my passion (lol), Claude IS better than me at it!
That's all from a real human, the rest is AI-generated from here. Until next time!
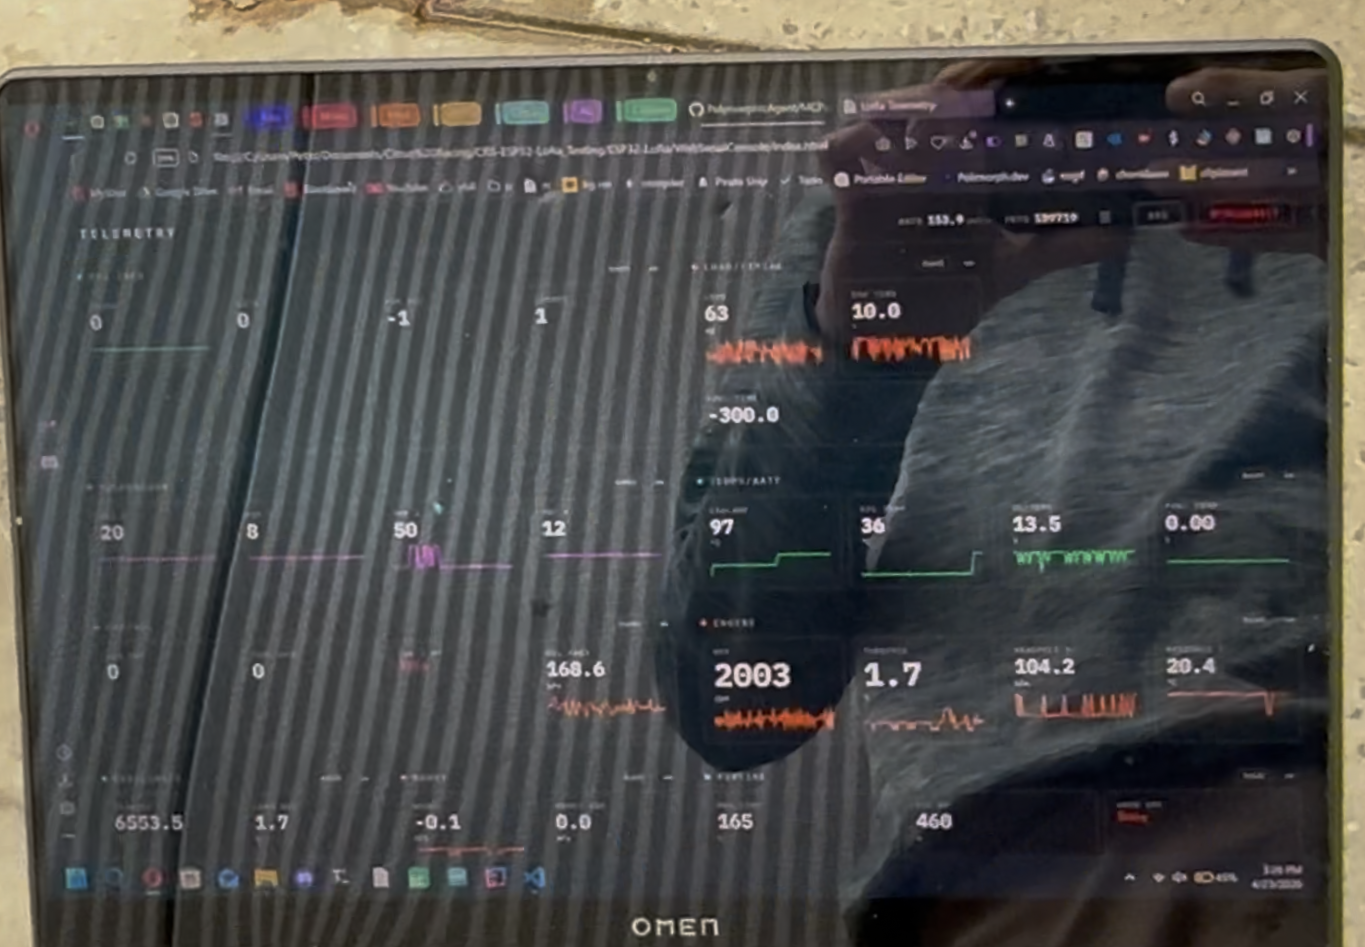
Picture of laptop running the web dashboard while car running
The old dashboard created DOM elements and redrew canvases on every incoming packet. At 3 IDs this was fine; at 16 IDs × 50 Hz it would freeze the browser. The new version separates data ingestion from rendering. Sparkline data uses typed Float32Array ring buffers with O(1) push, replacing Array.shift() which was O(n) and triggered garbage collection.
The WebSerialConsole is a browser-based real-time telemetry dashboard that receives LoRa-relayed CAN bus data from a race car via WebSerial. It decodes JSON packets from a receiver ESP32, renders live gauges with sparklines, and records sessions to IndexedDB for CSV export.
The entire frontend is a single-page application: one HTML file, one CSS file, one JS file (~1500 lines), plus Leaflet for the GPS map. No build tools, no framework — runs from a local file:// or any static server.
The browser's WebSerial API opens a serial port at 115200 baud. A readLoop reads lines from the serial stream, strips whitespace, and passes each to processLine. Connection state is reflected in the header badge (OFFLINE / LIVE) and the CONNECT / DISCONNECT button.
Each line starting with { is parsed as JSON. The id field (e.g., "0x640") routes the packet to the correct entry in store[id]. Field values are written to store, sparkline ring buffers are pushed, enum fields are resolved via ENUM_REV lookup tables, and the CAN ID is marked dirty[id] = true. Warning Source transitions and Engine State transitions fire toast notifications.
All parsed packets are unconditionally appended to the active recording's entries array (no throttle, no sampling).
sched() requests a single rAF frame. render() iterates REGISTRY, skipping clean CAN IDs. For each dirty ID, it looks up every field's gauge DOM element via gaugeEls[canId.fieldKey] and updates:
Numeric gauges: toFixed(fmt) with optional °C→°F conversion
Flag gauges: "ON" / "OFF"
Enum gauges: Resolved string or hex fallback
Sparklines: drawSpark() plots the ring buffer on a <canvas> with DPR scaling
The log panel is batch-rebuilt via innerHTML on a separate dirty flag, throttled per CAN ID (200ms visual interval).
Each panel (.widget) is placed with explicit grid-column and grid-row spanning. Panels are identified by a Panel ID (pid) — either reg_0x640 for REGISTRY-derived panels or custom_1 for user-created panels.
When a panel is moved or resized, resolveCollisions(movedId) pushes overlapping panels downward, then compactGrid() slides all panels upward to fill vertical gaps. Both operate on the lay map and W[pid].el visibility.
Layout is stored in localStorage under tl_layout_v3 as JSON containing: panels, gaugeState, lay, panelVis, nextPid. On load, rebuildWidgets() reads this and reconstructs the DOM. The same JSON structure is used for file-based export/import.
REGISTRY is a static array of 16 CAN ID definitions. Each entry specifies an ID, name, color, and field list with labels, units, format specifiers, and sparkline/big/flag/enum markers. REG_MAP[canId] provides O(1) lookup. REGISTRY is never modified — it is the source of truth for data decoding.
GAUGE_CAT[canId.fieldKey] is a flat catalog of every individual gauge definition, derived from REGISTRY at startup. Each entry carries its source CAN ID, label, unit, format, and feature flags.
{pid:'reg_0x640',// panel IDname:'ENGINE',// editable display namecolor:'#ff6d00',// editable panel colorisMap:false,// true for the GPS map panelgauges:['0x640.rpm',...],// ordered list of gauge keysdefaultGauges:['0x640.rpm',...],// snapshot from REGISTRY (for "modified?" check)}
Gauges can be moved between panels via drag-and-drop or the settings drawer dropdown. When a panel's gauge set differs from defaultGauges (set comparison, order-independent), the panel is marked "modified": the corner CAN ID tag gets a strikethrough and each gauge shows its source CAN ID.
gaugeEls[canId.fieldKey] maps every visible gauge to its DOM elements: { val, cvs, ctx, color, el }. This flat map decouples the render loop from panel membership — the renderer iterates by CAN ID (for dirty checks) and looks up gauge DOM elements by key regardless of which panel they belong to.
initDrag() registers pointer event handlers on D.grid. Pointerdown on a .widget-head initiates move mode; pointerdown on a .resize-handle initiates resize mode. A dashed green ghost element previews the target position/size. On pointerup, resolveCollisions + compactGrid run, then layout is saved.
The handler skips drag when the pointerdown target is a contenteditable title or color dot.
initGaugeDrag() uses HTML5 drag/drop (separate from pointer-based panel drag). Each gauge has draggable="true". Dragstart stores the gauge key; drop on a .widget-body moves the gauge to the target panel. Dropping on a gauge within the same panel reorders by inserting before the drop target. The panel body highlights with a dashed outline during dragover.
Panel titles have contenteditable="true". On blur, the new text is saved to the panel definition. The pointerdown handler skips drag initiation when the target is the title element.
Clicking the colored dot next to the title opens a native <input type="color">. Live input events update the panel color and all its gauges' sparkline colors. The input self-removes on change.
On stop, the recording is saved to an IndexedDB object store (telem_v1). On page load, all saved recordings are loaded into rec.saved. Recordings persist across browser sessions and page reloads.
exportRec() collects all unique field keys across all packets, writes a header row, then one row per packet with timestamp. The CSV is triggered as a download blob.
The bottom panel lists saved recordings with rename, export, and delete buttons. "EXPORT ALL" exports every recording. "CLEAR ALL DATA" wipes IndexedDB after confirmation.
Toast notifications slide down from the top center. Three types: error (red, for warnings), warn (orange), info (green). Auto-dismiss after 5 seconds with fade-out. Used for:
Warning Source transitions (0x64C): red toast when a new warning appears, green "cleared" when it returns to None
Engine State transitions (0x64D): toast on Stop (orange) and Crank (green)
A header button toggles between °F and °C. The preference is stored in localStorage('tempUnit'). Conversion is applied at display time only — store, rings, and recordings always hold the original °C values from the wire. TEMP_FIELDS identifies the four temperature gauge keys.
ENUMS defines forward maps (name→int) for Ignition Timing State, Engine State, Engine Speed Limit State, and Warning Source. ENUM_REV provides reverse maps (int→name, string→name). resolveEnum() handles three input forms: numeric, hex string ("0x02"), or already-resolved name — making it agnostic to whether the firmware or the dashboard performs resolution. Unknown values pass through as hex.
Smart gauge sizing on first load: solo-gauge panels get full-width gauges, 3-gauge panels get a full-width last gauge, and GEAR gets explicit full-width for prominence.
Leaflet renders OpenStreetMap tiles in the GPS POS panel with an inverted dark theme. The map lazy-initializes after DOM ready, throttles updates to 10Hz, and auto-pans to the latest coordinates. Tile layer degrades gracefully without network (coordinates still display in gauges).
The only external network dependency is Google Fonts (replaceable with local @font-face in /fonts/) and OpenStreetMap tiles (map degrades without network). All JS libraries (Leaflet) are vendored locally. The application runs entirely from file://.
16 default panels organized by CAN ID, each with a colored header dot, editable title, and CAN ID tag
Custom panels: create new empty panels via the "+" button in the settings drawer
Panel renaming: click the panel title to edit it inline
Panel recoloring: click the colored dot to open a native color picker; sparkline colors update live
Modified panel indicator: when gauges are added/removed, the CAN ID tag gets a strikethrough and each gauge shows its source CAN ID; indicator clears when the panel returns to its default gauge set (order-independent comparison)
Hide button (×): appears on hover in the gauge's top-right corner; hides the gauge from the dashboard; if all gauges in a panel are hidden, the panel auto-hides
Resize handle (⌟): corner grip appears on hover for 2D resize within the panel's inner grid
Warning Source alerts: red toast notification when the ECU reports a new warning (oil pressure, coolant temp, knock, etc.); green "Warning cleared" toast when it returns to None
Engine State alerts: orange toast on engine Stop, green toast on Crank
Auto-dismiss: toasts fade out after 5 seconds
No spam: only fires on transitions, not repeated for the same state
No build tools: runs directly from file:// or any static file server
Vendored libraries: Leaflet JS and CSS are included locally
Local fonts: IBM Plex Mono and IBM Plex Sans served from /fonts/ via @font-face (download from Google Fonts)
Graceful map degradation: GPS coordinates, speed, and satellite data display in gauges even without network; map tiles load when connectivity is available


 ikr
ikr